Writ Charts
When the founders of Writ reached out, their pitch was Tableau meets Figma. I was hooked.
The Data dashboard tools market is a crowded space, but I always felt that nothing out there truly transformed how teams collaborated on data since Excel and email — at least, not for business teams. In this context, the Tableau meets Figma framing offered a tantalizing vision.
I was at Meta when Figma was introduced, and it took over. Sure, the interface was nicer than Sketch, but the real transformation was in how it pulled engineers and product managers into the conversation. We stopped pasting mocks into slides and emails. Conversations and iterations happened, live, inside Figma.
That is the spirit I wanted for Writ Charts.
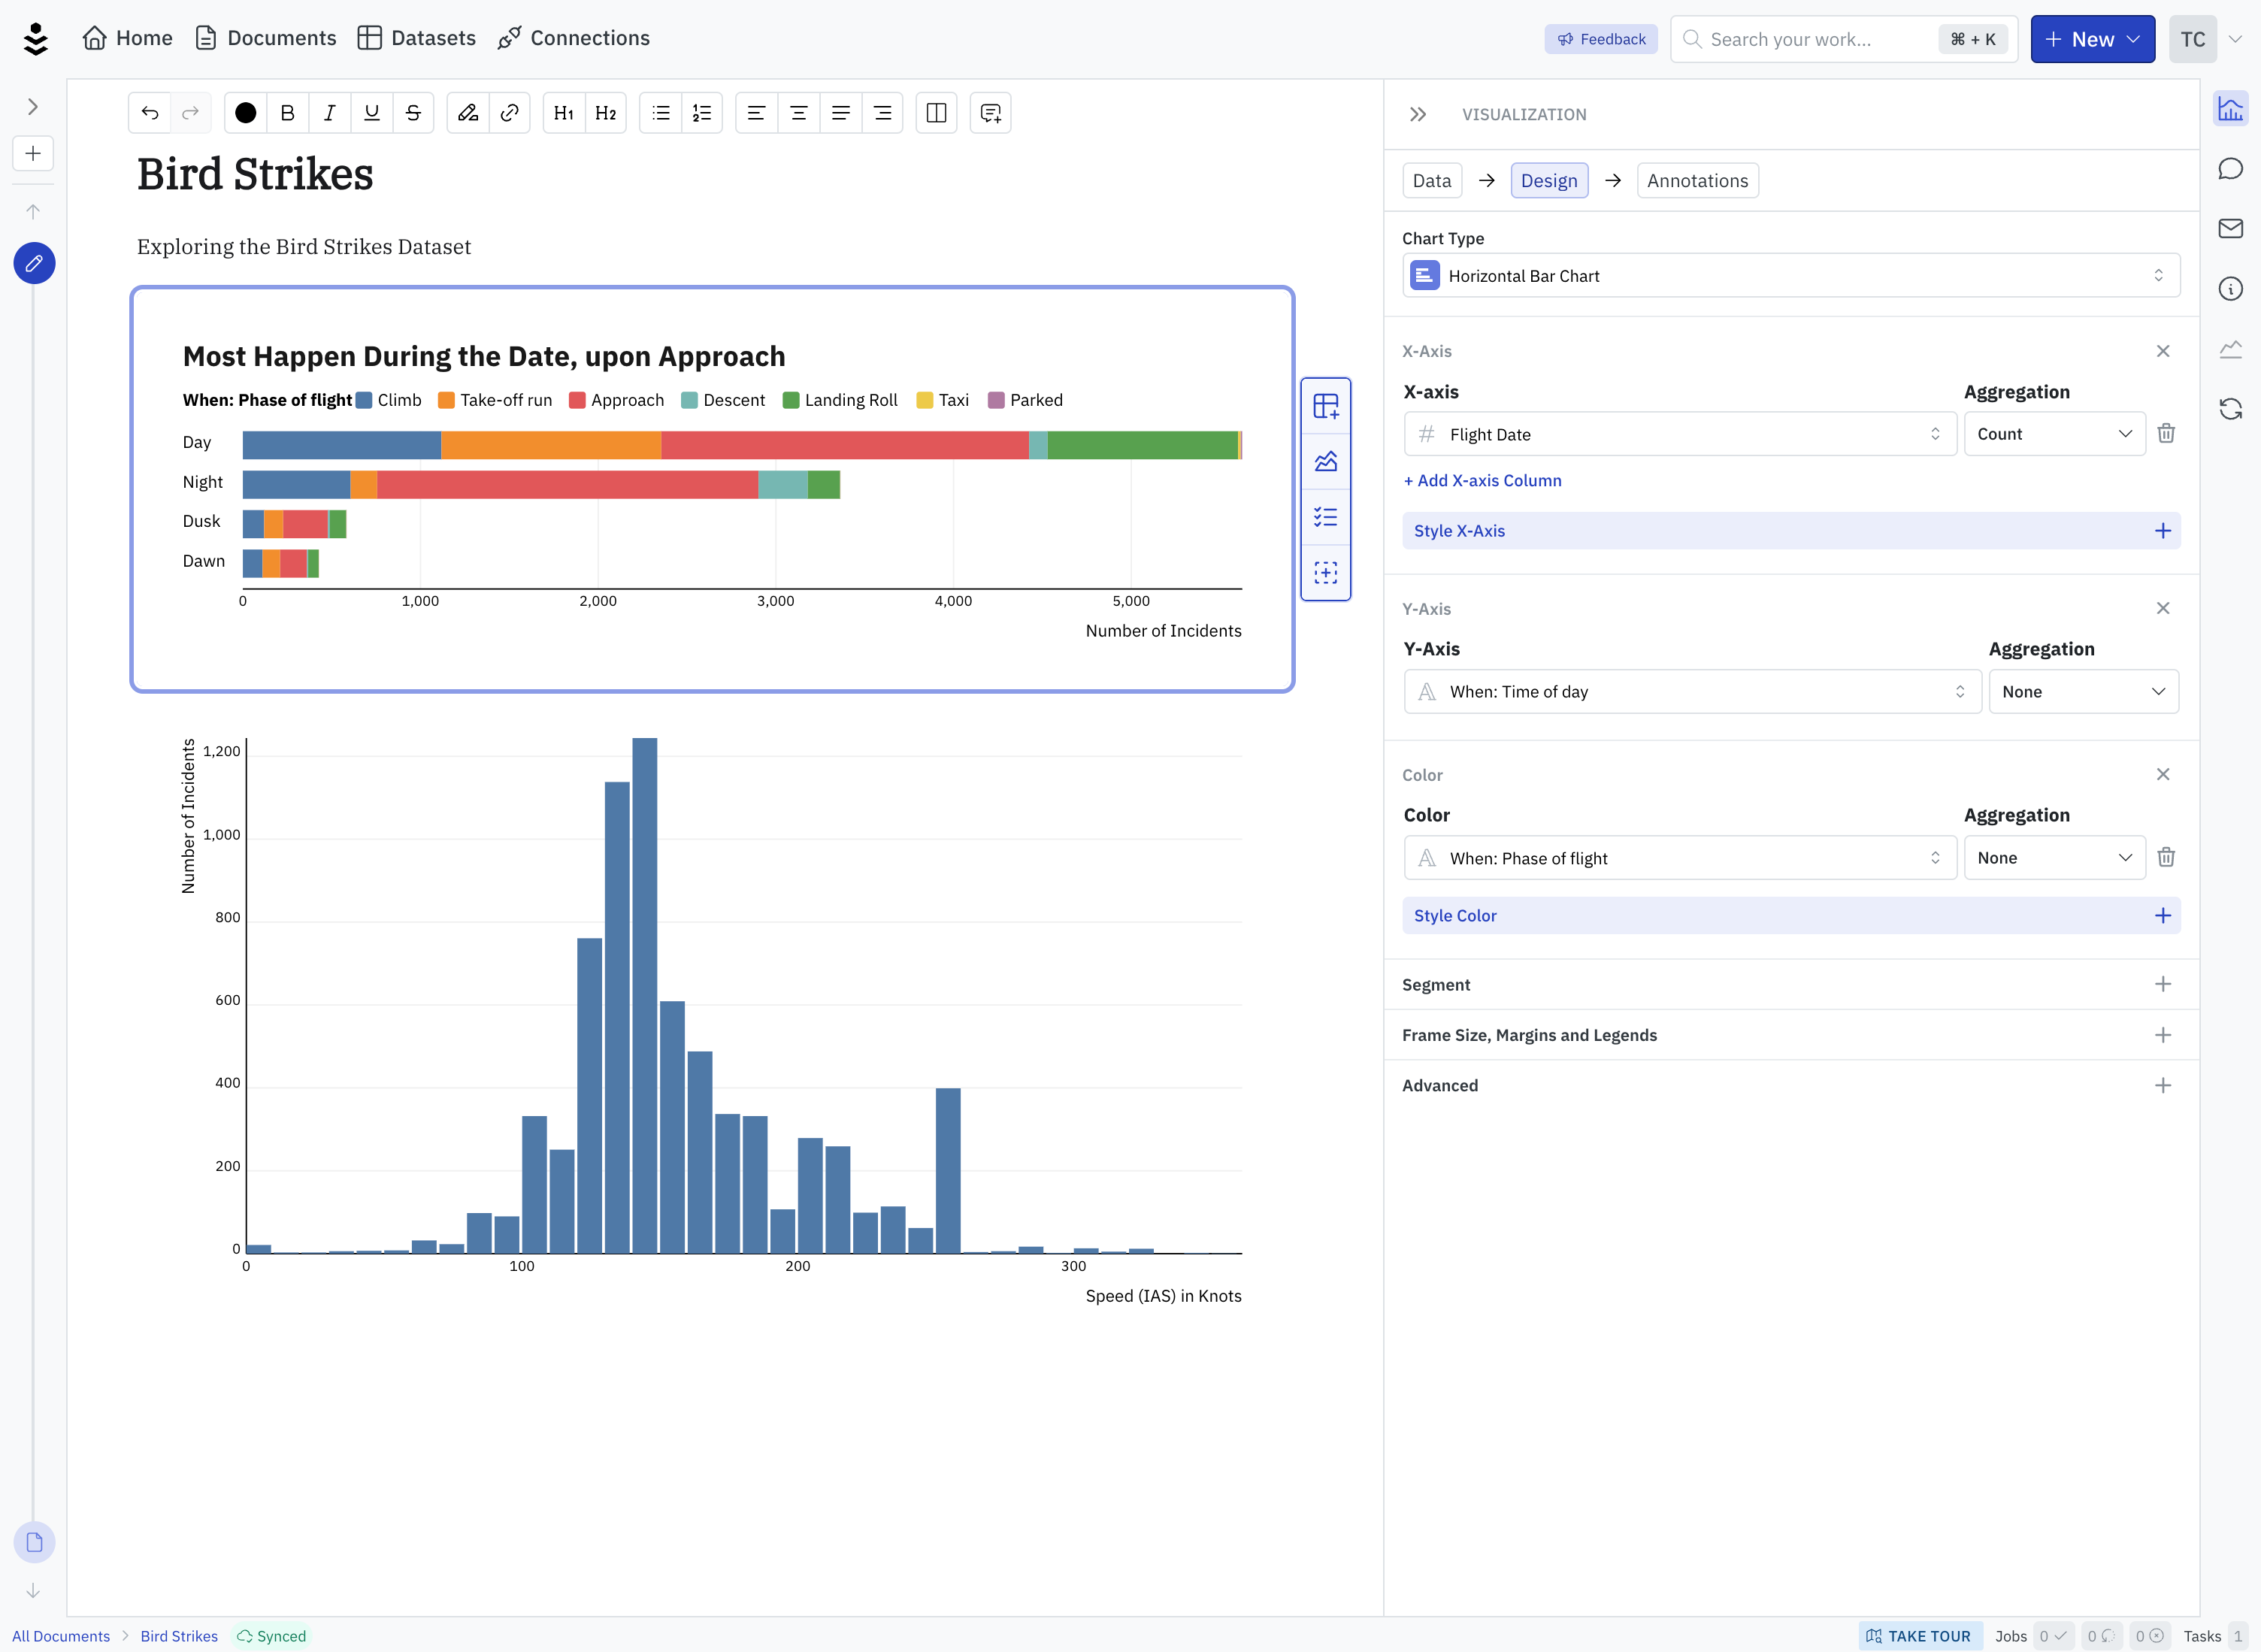
Fig. 1 — A Writ Document
This screen shows two key projects I designed and built at Writ.
First, the visualization rendering pipeline as demonstrated in the charts on the left.
Second, the configuration UI, shown in the right panel.
How might we build a conversational and collaborative space where analysts, stakeholders and business leaders come together to talk data and make decisions?
Data isn’t the Point. Decisions are.
Writ is designed for business intelligence. Business teams use data to inform decisions. Data is a means, not an end. In existing workflows, the data is in dashboards, but decisions get made in meetings, documents, and emails. Writ as a whole is designed to fit into this workflow, e.g.
-
Documents, not Dashboards
The primary object in Writ is a document, where narratives can be woven, and discussions can be had.
-
Emails are First Class
All charts can be viewed in emails. Comments can be added via email replies, fitting into existing workflows.
-
Everything is Versioned
Change is tracked, week over week. If you want to see how things evolved, there's one place to look.
With this in mind, I hope you'll see how Writ's product philosophy shapes the following four projects.
Visualization Rendering Pipeline
Unlike other types of business artifacts (e.g. documents and slides), data visualizations have two main sources of truth: the data, and the configuration. You cannot know what a chart looks like until those are joined together. What's more, the data changes over time, sometimes in unexpected ways.
Sources
- Query
- Filters
- Configuration
- Annotations
Data Processing
- Fetching
- Aggregation
- Segmentation
Encoding
- Scales
- Ticks
- Colors
- Formats
Layout
- Geometries
- Axis
- Legend
View
- Rendering
- Interactions
In order to adapt, I designed the pipeline to be a graph of computations, which regenerate the chart as inputs change. With this pipeline design, many elements can be re-used across chart types.
Fig. 2 — Various Chart Types
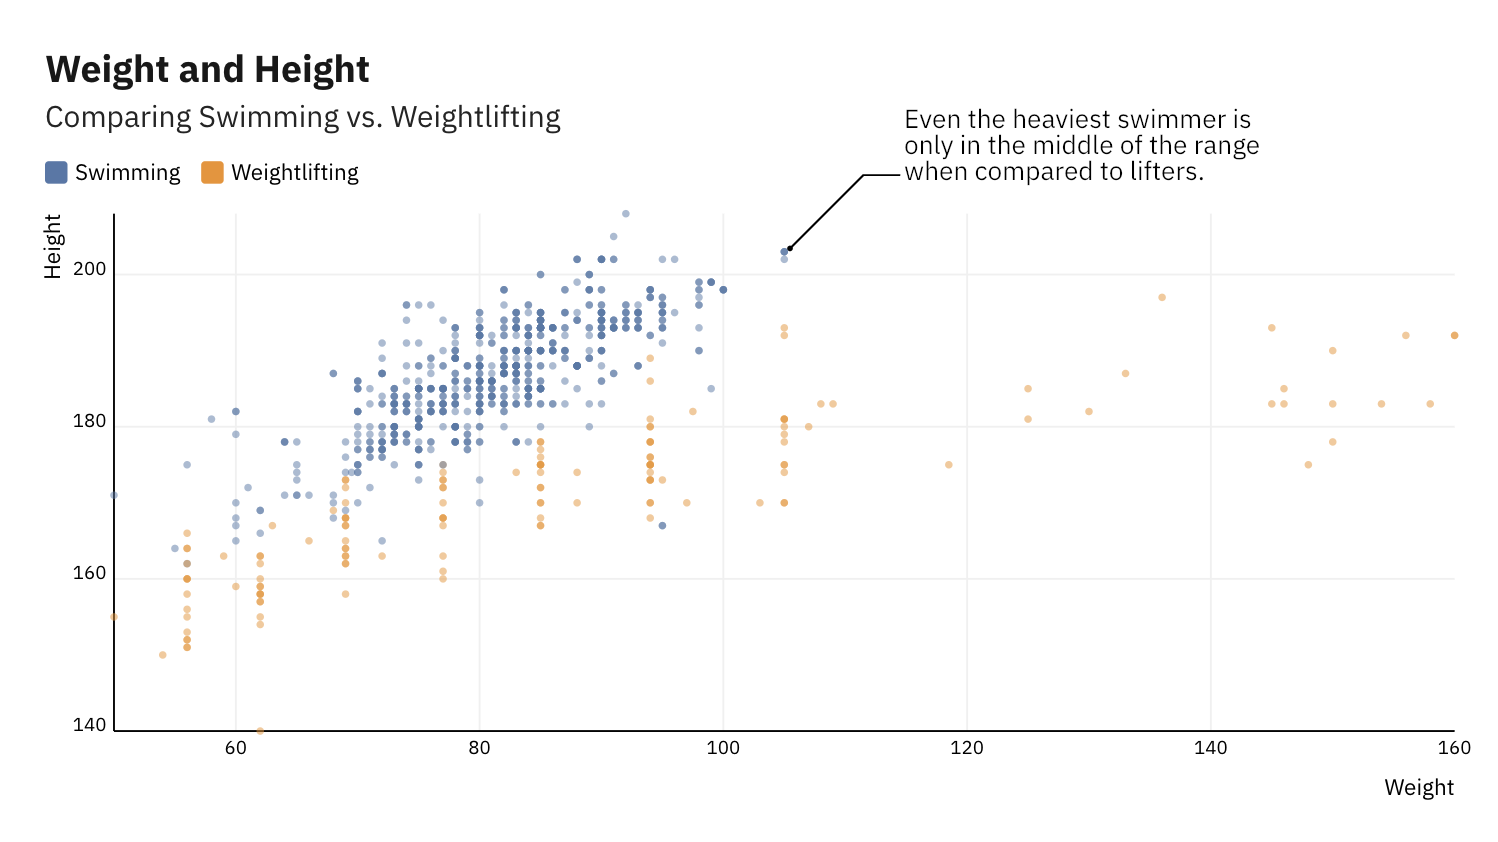
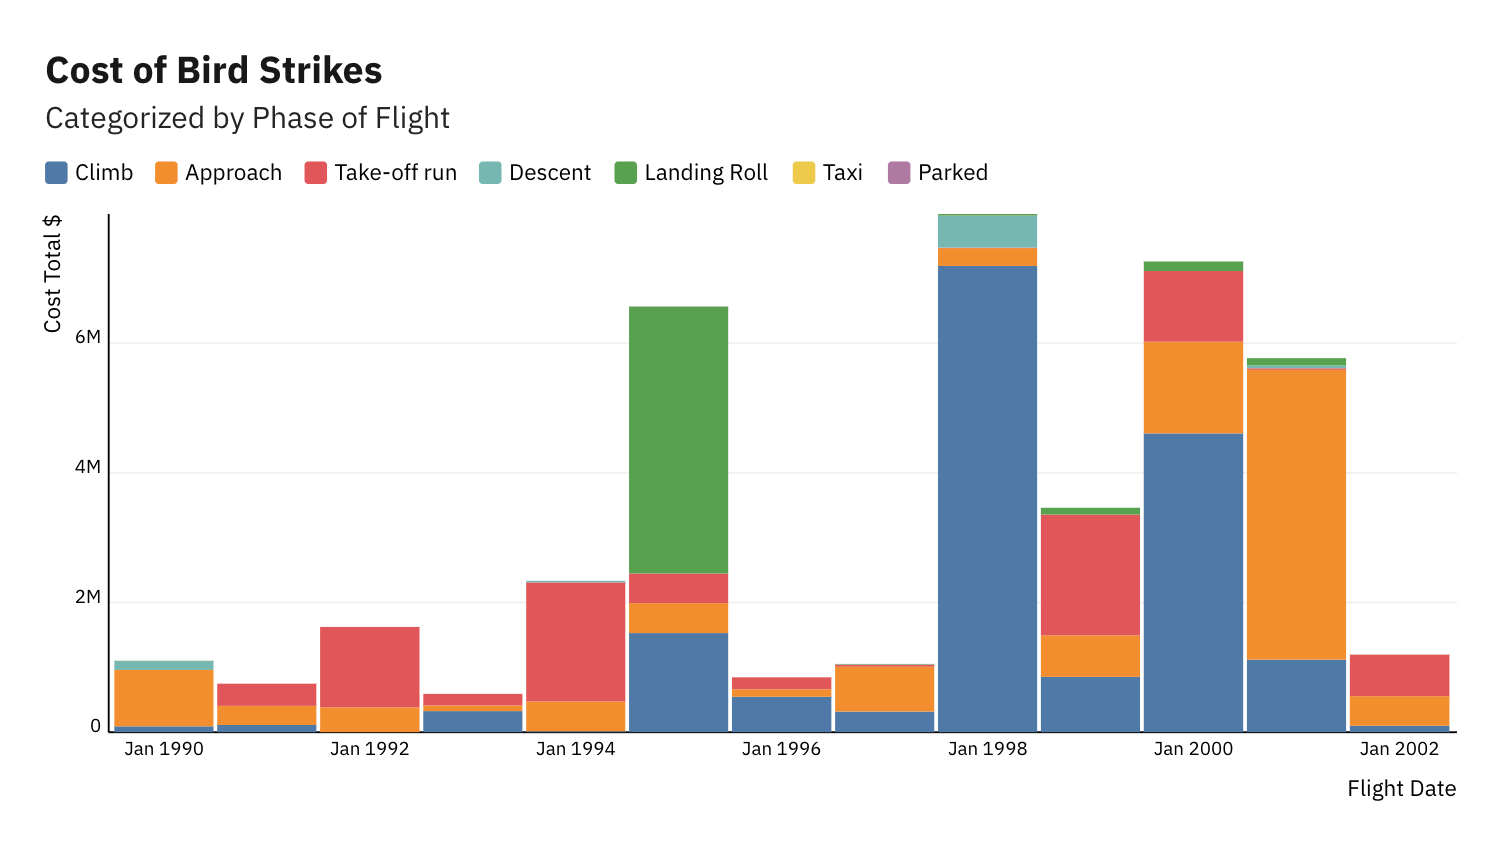
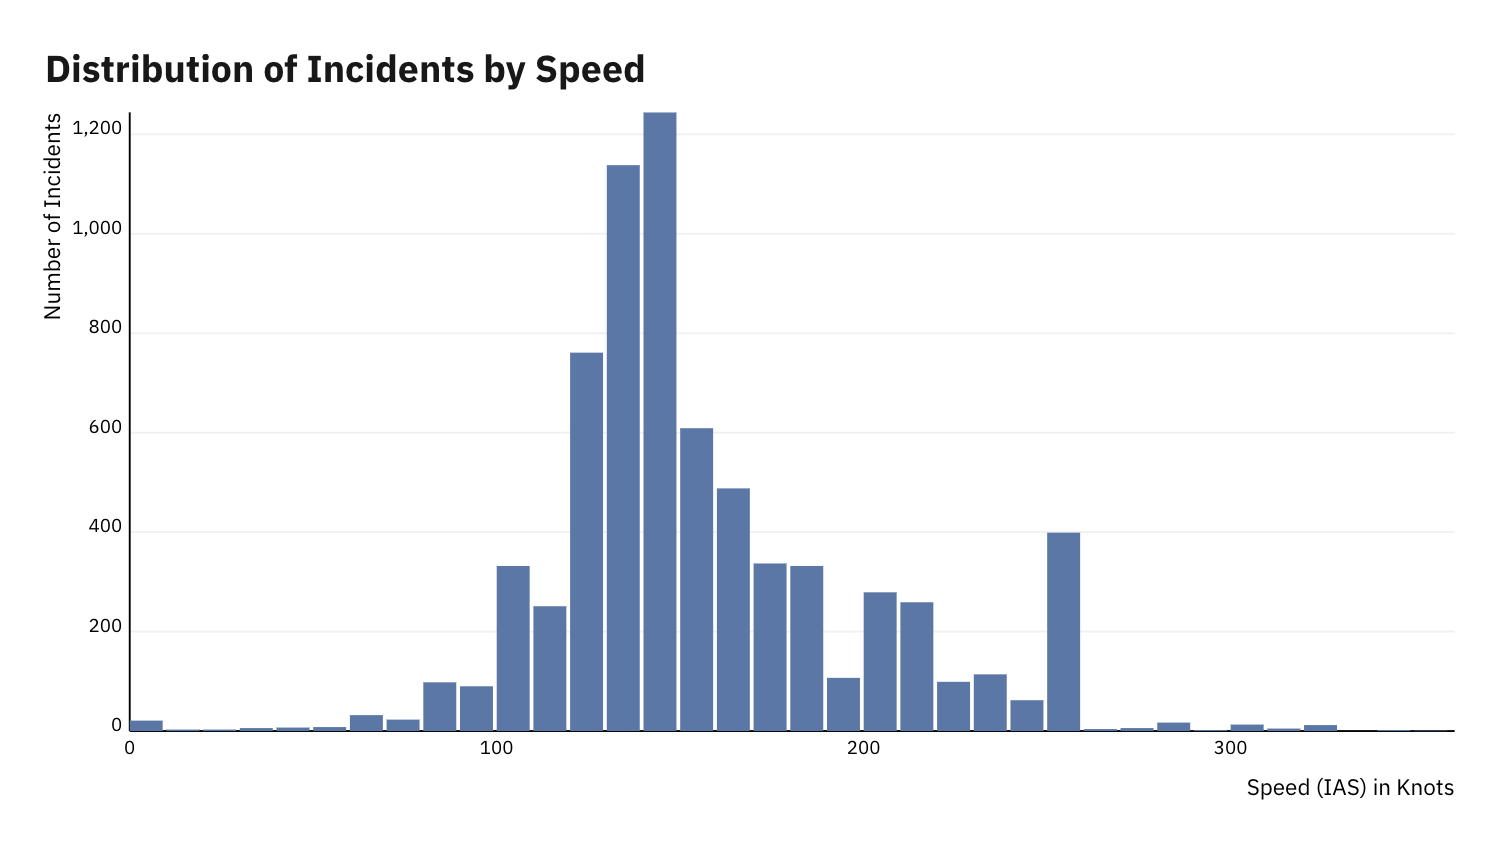
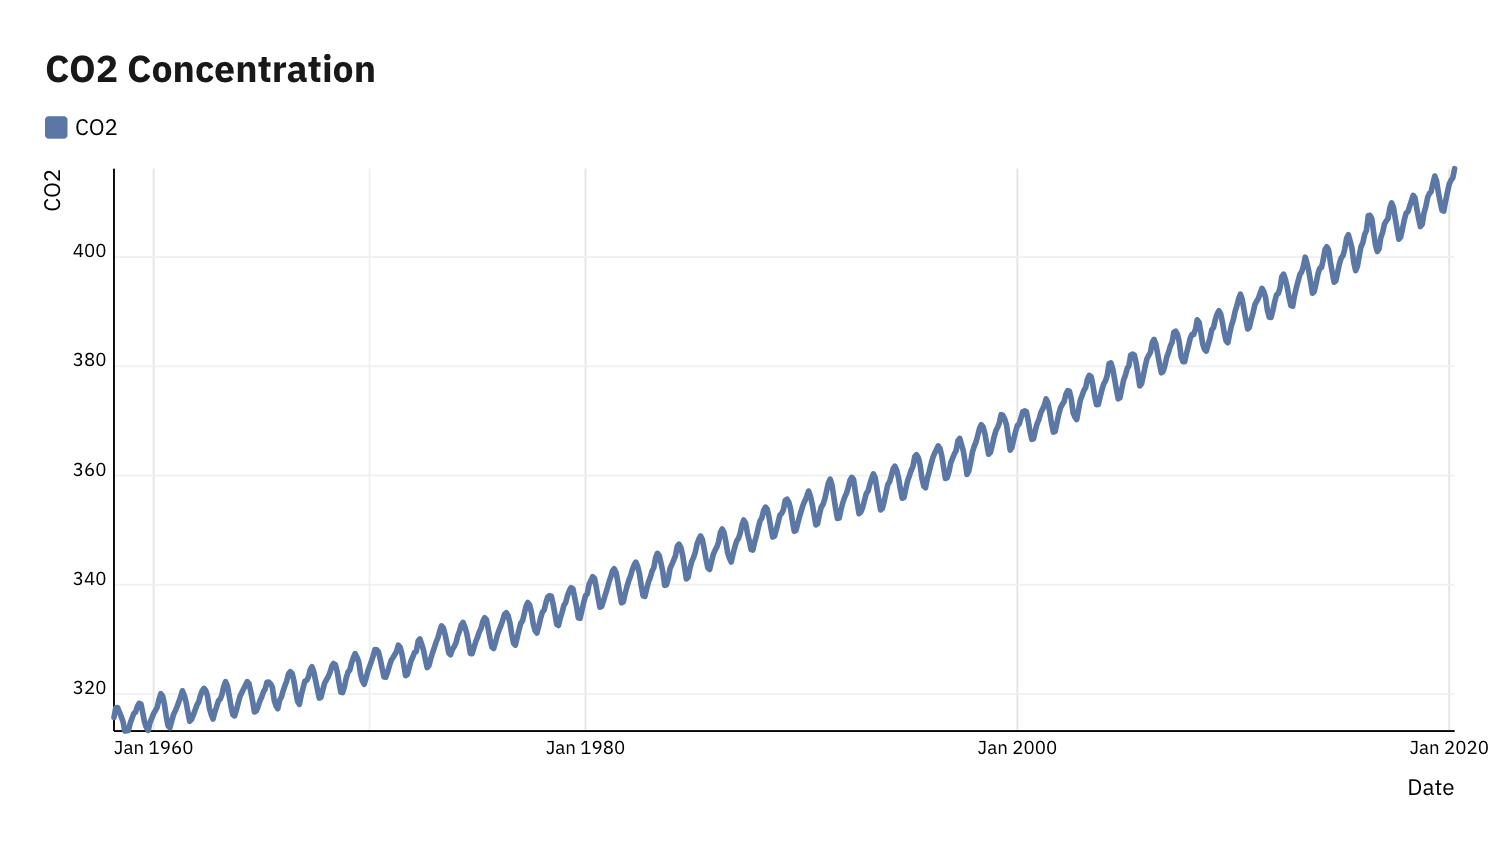
Chart Configuration
The design of the visualization pipeline is downstream from the design of the configuration system, for which I had two principle goals.
- Minimize decisions required to generate a good looking chart
- Support more and more customization over time
| Required Parameters | Optional Parameters |
|---|---|
|
|
Chart Annotations
As much as we would like data to speak for itself, crucial context for understanding data often requires additional explanation.